Trend Indicator with BUY SELL signalsThe Script can be used to identify the main trend and take BUY/SELL decisions in the lower time frames.
The tool can be applied as follows
1) Apply the tool your favorite chart
2) Select the main trend.
3) Go to lower time frames to check the BUY/SELL signals. Example: If the selected main trend is 4 hrs then go to time frames below 4 hrs to find the entry and exit positions.
Feel free to reach out to me if you need any further information
Cerca negli script per "the script"

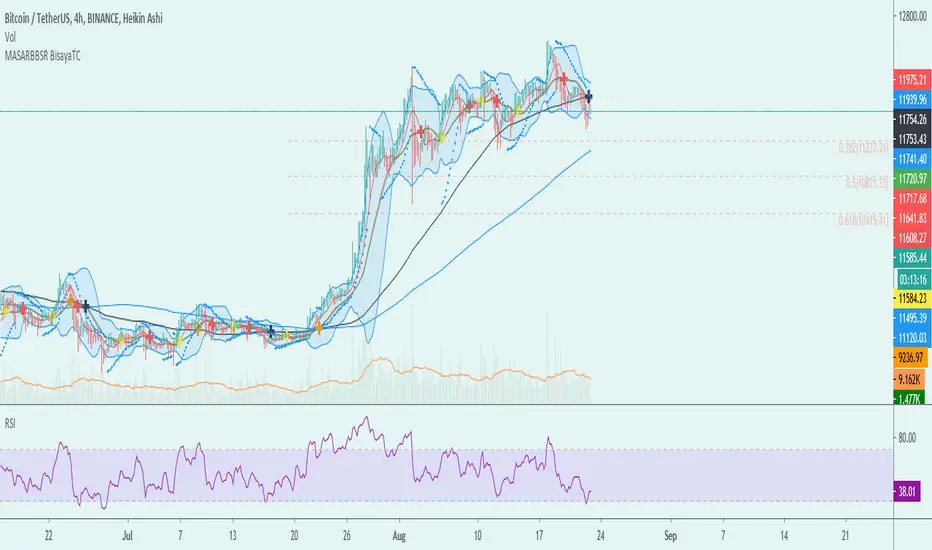
MA-SAR-BB-SR - BisayaTCThe script allows you to use multiple indicators such as Moving Averages, Parabolic SAR, Bollinger Bands, Support and Resistance and it includes alerts for each indicator.
MA - The moving average (MA) is a simple technical analysis tool that smooths out price data by creating a constantly updated average price. The average is taken over a specific period of time, like 10 days, 20 minutes, 30 weeks or any time period the trader chooses.
SAR - The Parabolic SAR is a technical indicator developed by J. Welles Wilder to determine the direction that an asset is moving. The indicator is also referred to as a stop and reverse system, which is abbreviated as SAR. It aims to identify potential reversals in the price movement of traded assets.
BB- Bollinger Bands are envelopes plotted at a standard deviation level above and below a simple moving average of the price. Because the distance of the bands is based on standard deviation, they adjust to volatility swings in the underlying price.
SR - Support and Resistance are certain predetermined levels of the price of a security at which it is thought that the price will tend to stop and reverse. These levels are denoted by multiple touches of price without a breakthrough of the level.
DISCLAIMER: For educational purposes only. Nothing in this content should be interpreted as financial advice or a recommendation to buy or sell any sort of security or investment including all types of crypto. DYOR
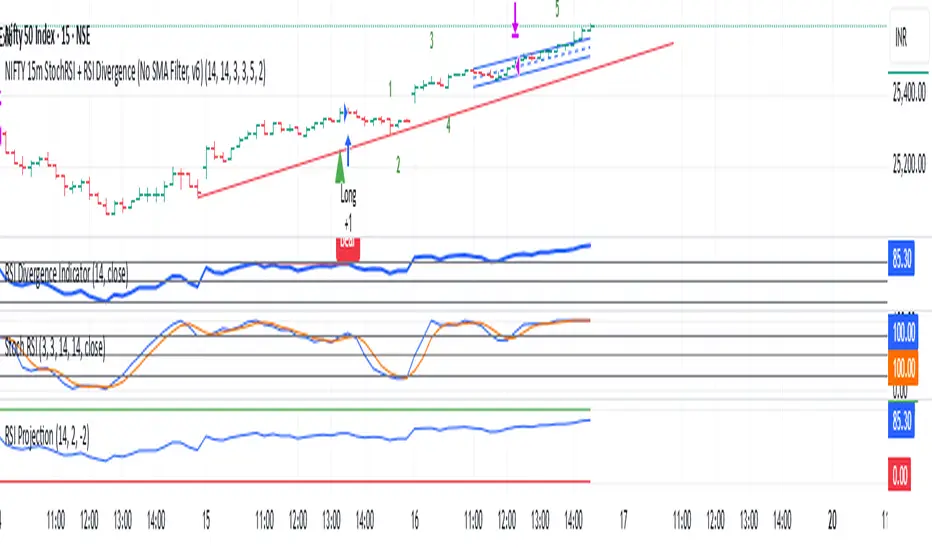
Scalper ALThe script is an updated version of our old Scalper 1.1. It includes a linear regression line for trend indication, a moving average line and the buy sell labels. The fluctuation and strength of the trend can be discerned from Pearson's value and its sign. Algorithmic trading can be done by setting an alarm. There is a provision to set target and stop loss in setting window(for algo trading). It's more profitable on the 15 minute chart, and applies to any type of stock.The color of the moving average represents the short term trend.
Contact us using the links below to gain access to this indicator

EMA 5/10/21 SMA 50/100/200The Script is mixture of both EMAs and SMAs. EMA 5/10/21 are powerful indicators for short term providing more weightage to the recent prices. SMA 50/100/200 provide the long term view.
5 Day EMA: This is a sign of strong momentum. It tracks the trend in the short term time frame. This is support in the strongest up trends. This line can only be used in low volatility trends with strong momentum. A break back above this line is a sign for me that an uptrend may be resuming. I primarily use it as an end of day trailing stop. It is rare that this line does not break intraday, even in the strongest trending markets.
• 10 day EMA: The 10 day EMA is a great moving average to use to keep you on the right side of the major market trend. It is usually the first line to be lost before any real trouble begins. It can be used as a standalone signal in some stocks and markets that tend to trend strongly in one direction for long periods.
• 21 day EMA: This is the intermediate term moving average. It is generally the last line of support in a volatile uptrend. To me, it is the inevitable reversion to the mean in a market when it finally pulls back after an extended trend.
• 50 day SMA: This is the line that strong leading stocks typically pull back to. This is usually the support level for strong uptrends. It is normal for uptrending markets to pull back to this line and find support. Most bull markets and uptrends will pull back to this level. It is generally a great “Buy the dip” level.
• 100 day SMA: This is the line that provides the support between the 50 day and the 200 day. If it does not hold as support, there is a high probability that the 200 day SMA is the next stop. This is the deeper pullback level in bull markets and uptrends. It usually presents a great risk/reward ratio in bull markets.
• 200 day SMA: Bulls like to buy dips when markets are trading above the 200 day moving average, while bears sell rallies short below it. Bears usually win below this line, as the 200 day becomes longer term resistance, and bulls buy pullbacks to the 200 day as long as the price stays above it. This line is one of the biggest signals in the market telling you which side to be on. Bull above, Bear below. Bad things happen to stocks and markets when this line is lost.

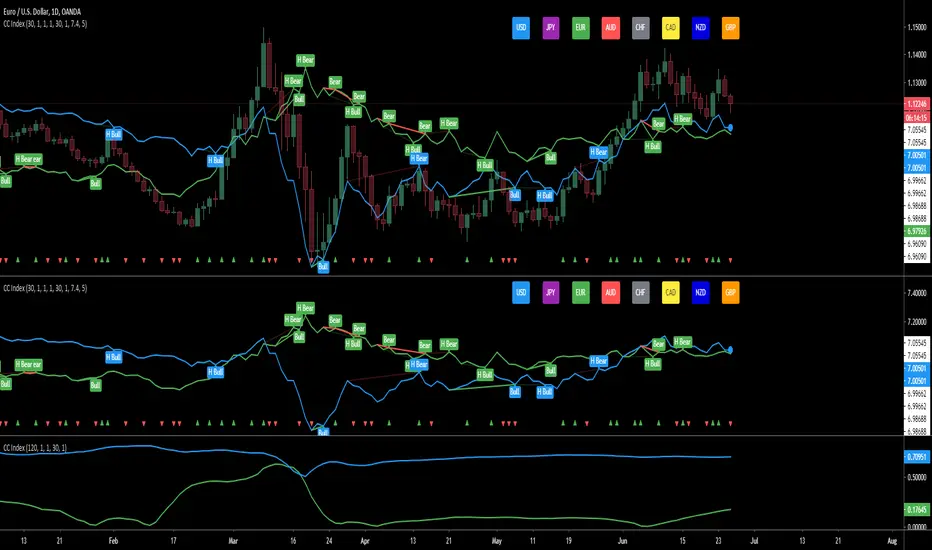
Currency Index - based on Correlation CoefficientThe script is calculating the correlation between the current pair and the corresponding indexes and then displays the driving index based on the higher correlation.
for example: on EURUSD - calculates the correlation between EURUSD with the USD index and the correlation between EURUSD with the EUR index and then displays the winning/driving index.
- the arrows at the bottom are showing when both indexes are going in the same direction
- there are options to show divergences on the winning index
- option to display either the correlation or the winning index
- and option to be able to use while in replay mode for back testing, based on the last close to avoid repainting
- option for the length of the correlation
- the last color of the driving index is related to the index that is being displayed where:
AUD - red
CAD - yellow
CHF - grey
EUR - green
GBP - orange
JPY - magenta
NZD - dark blue
USD - light blue
- it works automatically on all the major pairs
- the last 4 options are for finding divergences between the price and the index
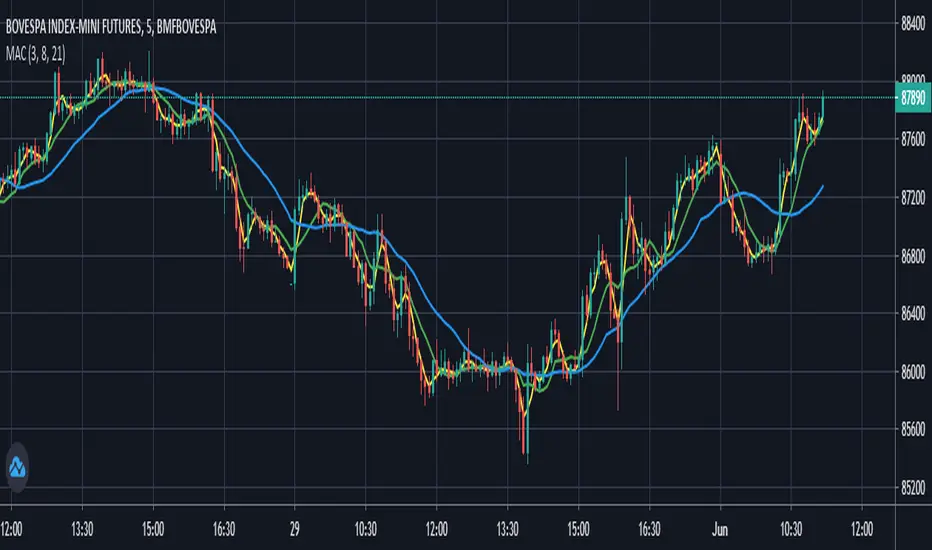
Moving Averages Convergence (Agulhada do Didi)The script is based on a strategy developed by Odir “Didi” Aguiar called “Agulhada do Didi”.
It consists in the use of 3 moving averages:
SMA 3
SMA 8
SMA 21
Strategy:
When the averages come together, preferably they pass through a candle, there is a signal. The crossing of the short average (3) with the long average (21) provides us with a confirma-tion of the entry.
Buy:
The average of 3 periods comes out on top, 8 goes in the middle and 21 goes down.
Sell:
Average of 21 periods comes out on top, 8 in the middle and 3 down.
Premarket High/LowThe script draws the high and low of the premarket session and based on these levels the ATR is added and also displayed on the chart as lines.
You can change:
- The Session Timeframe
- The ATR Multiple
- If the Aftermarket Session should be included

Candle Patterns StrategyThe script allows you to test popular candlestick patterns on various instruments and timeframes. In addition, you can configure risk management (if the value is zero, it means the function is disabled), and you can also specify the time of the trading session (for example, so that the positions are not transferred to the next day).
The author is grateful to JayRogers and Phi35, their code examples helped a lot in writing the strategy.

Lyiness_Naked-Trading-ProjectThe script is based on the Naked Trading Strategy.
It is based on 2 time periods, by which one is able to interpret a good entry.
You can change the 2 periods in the menu to identify a good result depending on the length of the trade.
In set mode, it displays the highs and lows of the day.
The blue thin line is set to the weeks high and low. You can adjust this in the menu to the desired option.
You can enter in the option Kanal_Periode1 / 2:
A number that reflects the minutes. (1-.....)
D = day
W = weeks
M = month

SuperRadu Trade Assistant v0.2The script uses higher and lower swings to generate the resistance(red) and support (green) also the orange color represents the crossunder midline.
It will generate a new sell or buy entry suggestion when the price reject the resistance or the support and the median line it will confirm the trend direction between low high swings in this way you are able to make a better decisions and to place stop or take profits on a real targets.

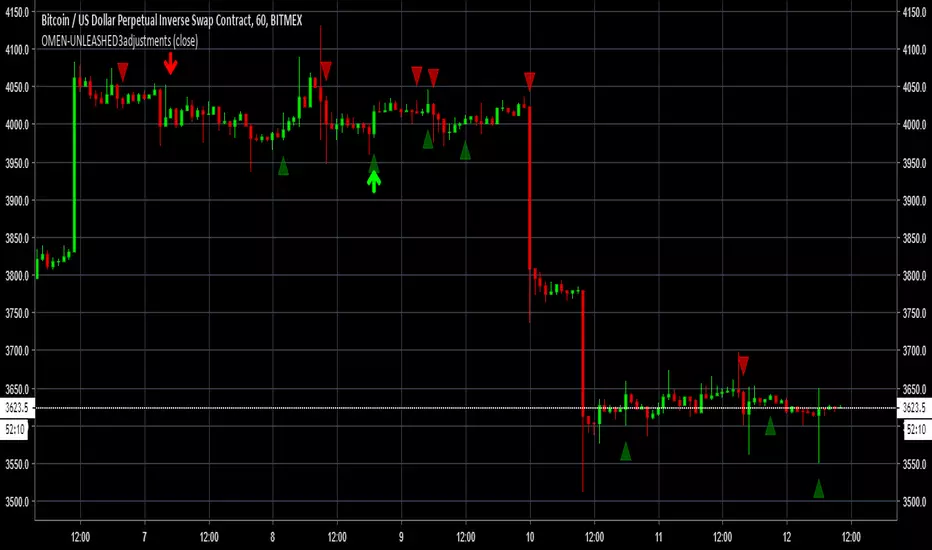
OMEN-UNLEASHEDThe script needs a double confirmation and this will be simplified in the future with alerts.
To LONG-- You will need a Green Arrow and then go Long when the Green Dot appears within the same candle or up to 1-3 candles after the Green Arrow appears.
-- Green Arrow + Green Dot after Green Arrow + Green Dot appears on same candle or within 1-3 candles after Green Arrow
To SHORT-- You will need Red Arrow and then Short when the Red Dot appears within the same candle or up to 1-3 candles after Red Arrow appears.
--- Red Arrow + Red Dot after Red Arrow + Red Dot appears on the same candle or within 1-3 candles after Red Arrow appears.
Updates will be added soon to include a new signal to make sure LONGS and SHORTS are not missed with double confirmation.
Footprint Imbalance Reversal ZonesThe script detects blowouts and displays buy and sell volume as levels.
Green lines = bullish zones (potential support / buying pressure)
Red lines = bearish zones (potential resistance / selling pressure)
---------------
Trade ideas:
---------------
Price approaching a green zone → potential bounce/support.
Price approaching a red zone → potential rejection/resistance.
Combine with other indicators or price action for confirmation.
-----------------
Configuration
-----------------
Inputs:
Imbalance Threshold (%) → higher = only very strong imbalances trigger zones
Bars to form cluster → number of consecutive imbalance bars needed
Zone Extend Bars → how far each zone line extends into the future
Minimum bar volume → ignore low-volume bars for cleaner zones
Use tick-rule volume estimate → leave true if no real bid/ask data
Max saved zones → max number of zones stored (oldest removed if exceeded)
------
Tips
------
Best used on intraday or short-term charts where volume imbalances are meaningful.
Adjust Minimum bar volume to filter out low-volume noise.
Combine with candlestick patterns, RSI, or moving averages for higher-probability trades.
For long-term charts, consider increasing Bars to form cluster to capture stronger levels.
Combine with price action, candlestick patterns, or other indicators for better trade signals.

Volatility Trend FollowerThe script combines several classic technical analysis techniques:
SuperTrend / Adaptive Band - The main idea comes from the SuperTrend indicator, which uses ATR (Average True Range) to create a trailing band that adapts to volatility
ATR (Average True Range) - A volatility measure developed by J. Welles Wilder Jr.
EMA (Exponential Moving Average) - Used as a global trend filter
Heikin Ashi - An option to smooth prices and reduce noise

Algo & Dark Pool Activity - Find Hidden LiquidityThe script is designed to highlight potential algorithmic buying pressure and dark pool accumulation proxies on a TradingView chart. It overlays signals directly on price bars so you can visually spot when unusual activity may be occurring.


Previous Day/Week High and Low • Ahmed SiddiquiThe script shows Previous Day's Candle High and Low & Previous Week's Candle High and Low which updates automatically everyday and every week. There are few more modification will be done in next versions.

Candle High/Low RaysThe script identifies a specific candle at a time you define and draws two horizontal rays:
High Ray - Extends from the high of that candle indefinitely to the right
Low Ray - Extends from the low of that candle indefinitely to the right
These rays show the last 3 days of midday candle levels on your chart, helping you identify important support/resistance levels.

Monster PerfectionThe script tracks confluence between Stochastic and RSI. It marks candles where the Stochastic crosses in extreme zones while the RSI shows divergence with price. These signals point to possible short term reversals.

XAUUSD Fisher Transform Dashboard — Trend & Momentum InsightsThe script offers an educational visualization of trend and momentum on XAUUSD by combining the Fisher Transform with EMA direction. It plots momentum shifts, trend alignment, and includes a concise dashboard showing trend bias, the latest crossover event, and customizable percentage-based reference markers.
This tool is for market analysis and study purposes only and does not provide trading advice.

Breakout an Reversal Signal Detector with Colored in Bar TrendsThe script detects breakouts and/or reversals: when candles close outside the recent period high or low, it prompts a signal, indicating a change in market trend.
You can customize the bar color to indicate trending phases.
It can be used effectively to identify both breakouts and reversals, making it a versatile tool for trend and reversal analysis.
Simple yet effective.
Enjoy!

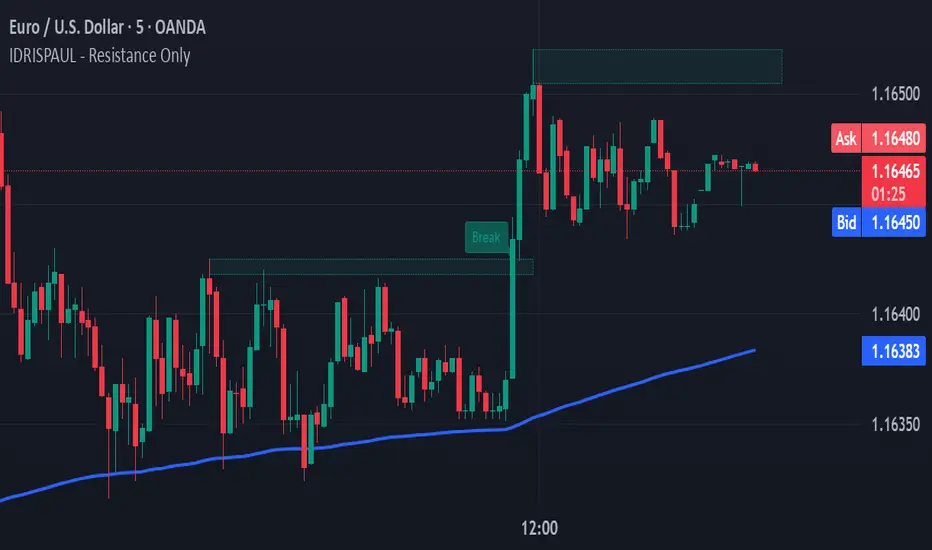
IDRISPAUL - Resistance OnlyThe script continuously scans recent price action to identify pivot highs that qualify as potential resistance zones. Once a resistance level is detected, the indicator:
Draws a resistance box around the identified zone.
Monitors for breakouts above that resistance.
Tracks potential retests and confirms valid retests when price action revisits the broken level.
Triggers alerts for each event: new resistance, breakout, potential retest, and confirmed retest.
All levels and labels automatically update as the chart evolves